The Coolest Spots in the Hottest Cities
Last week Bloomberg explored the coolest spots inside the world's sweltering cities. Using thermal radiometer equipment aboard orbiting satellites NASA and ESA are able to explore ground temperatures at a street-by-street level. The detailed maps of these temperature recordings can then be used to discover which areas in towns and cities are urban heat islands and which areas provide cool relief during the hottest weather.
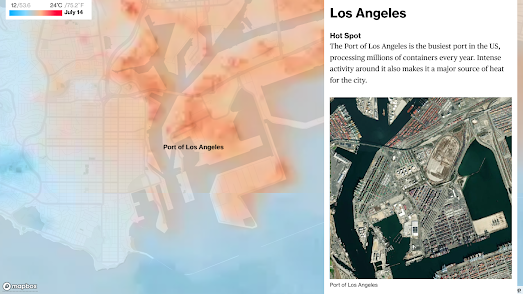
Bloomberg has used satellite imagery from ESA to examine in detail the hottest and coolest neighborhoods in a number of global cities (London, Delhi, Fez, Los Angeles, Melbourne and Seville).
Their analysis of these maps is at times unsurprising. Most people are probably already aware that parks and trees can provide relief from extreme temperatures. However the maps also reveal that we can learn from the past. For example in Fez, Morocco satellite imagery reveals that modern suburbs built along wide roads are much hotter neighborhoods than older neighborhoods in the city which were built with clay bricks and much narrower streets.
In Seville architects are experimenting with an ancient Iranian technology - qanats. These are underwater aqueducts which are used to cool the buildings built above them. Los Angeles is experimenting with using reflective paint on rooftops to reflect sunlight back into space. While Melbourne has started to install permeable asphalt to help rainwater reach tree roots, which helps promote the healthy growth of trees and the shade provided by healthy tree canopies.


Comments