The Climatological Map of the World's Oceans
The European Union's research project 'Climatological Database for the World's Oceans, 1750-1850' extracted weather data from over 280,000 sailing ship logbooks written between 1750 and 1850. The resulting database, containing comprehensive weather observations and voyage details, is an invaluable resource for the study of climate and maritime history.
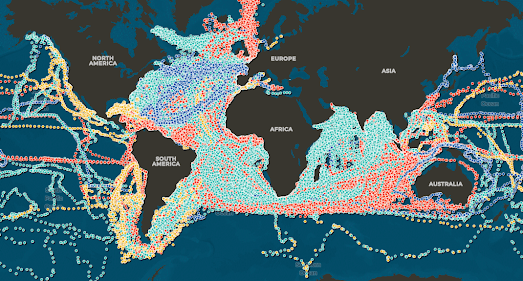
The Library of Congress has used the resulting database to create an interactive map. The Climatological Database for the World's Oceans, 1750-1850 allows you to explore the logbook information of Spanish, Dutch, French and English sailing ships as they navigated the globe in the 18th and 19th Centuries. If you zoom in on the map you can view the tracks of individual voyages on the map from the trail of individual marked entries over time. Click on a marker on the map and you can view the name of the plotted sailing ship, the date of the log entry and read any entry record related to the day's climate.The ship markers on the map can be filtered by country. This means that you can get a good overview of where in the world France, Spain, the Netherlands and Britain were trading and colonizing during the period 1750-1850. For example if you filter the map to show only the entries from French and Spanish ships you can see that sailing ships from these countries made relatively few trips to the Indian Ocean. On the other hand many British and Dutch ships in this period were making journeys through the Indian Ocean to India and the East Indies.

On this map you can also filter the ship positions shown on the map by country of origin. In addition you can use the time-line at the bottom of the map to filter the map by any range of years from 1750 to 1850. This map also allows you to filter the data by wind speed patterns and by other weather and climatic conditions. If you click on a hexbin on the map you can also read entries from the ship logbooks yourself.


Comments