Interactive Geological Maps

William Smith was the first geologist to create a nationwide geological map of the UK. A geologic map reveals the distribution of geological features such as different types of rocks. Smith's beautiful 1815 map visualized Britain's geological types using different colors for different types of geological feature.
The British Geological Survey is upholding the tradition of beautiful geological maps with its own Geology of Britain interactive map. This interactive map follows the same methodology used by Smith in the 19th Century. On the map different colors are used to show different types of bedrock geology. If you click on the map you can learn more about the bedrock geology and superficial deposits at the selected location. The information provided includes details on when and how the displayed type of geology was originally formed.
You can view interactive versions of William Smith's Maps online. These interactive maps allow you to explore Smith's original geological maps of England, Scotland & Wales in very close detail. The interactive map interface allows you to view geo-rectified overlays of a number of William Smith's maps including his original 1815 geological map and his 1828 New Geological Map of England and Wales.
Digital geological maps can add a level of interactivity to the visualized geological strata. In other words online interactive maps can be used to reveal more information about the geology being mapped. A good example of this is the Geological Map of the Grand Canyon and Vicinity.
The Geologic Map of the Grand Canyon and Vicinity is a beautiful Leaflet.js based interactive map of the Grand Canyon. The map is based on data gathered by the U.S. Geological Survey. The map uses different colors to show the different rock units and geologic strata in the Grand Canyon and surrounding area. The map also includes contour lines. If you hover over the map the geologic strata at that location is revealed in the small information window. If you click on the map you can learn more about that geologic strata in the information dynamically loaded below the map.
Another good example of an interactive geological map is the Geologic Map of Arizona. The Geologic Map of Arizona also includes interactive colored geological features. If you mouse over a feature on the map the geological information is revealed on top of the map. The Geologic Map of Arizona also visualizes the different types of geological faults which can be found in Arizona.
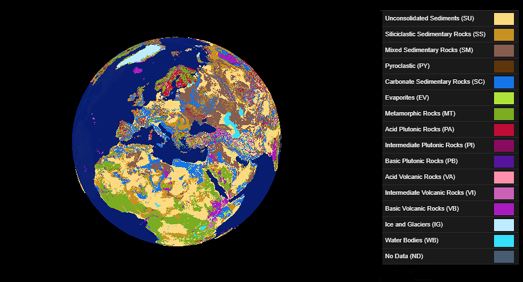
You can view a global interactive geological map on the Lithological Map Viewer. The Lithological Map Viewer is a 3D globe showing the types of rock which are present at the surface of the Earth across the whole planet.
Lithology is the classification of rocks based on their visible physical characteristics at outcrop. These classifications are normally based on the color, texture, grain size, and composition of the rock. Because lithology classifies rocks at outcrop it can play a key role in understanding processes occurring on the surface of the Earth, for example processes concerning soils, ecosystems, rivers, and oceans. The three main types of rock are sedimentary, igneous, metamorphic. The Lithological Map Viewer shows sixteen different classes of rock.


Comments