Fusion Tables & the Google Maps API
Version 3 of the Google Maps API has a Fusion Tables Layer class that allows you to create a Google Map from data held in a Google Fusion Table.
Map developers can use a Fusion Table to store location, line, polygon and associated data that they wish to display on a Google Map. Fusion Tables support an SQL like query language, which you can use to filter the features shown on a map. This means that a map developed from a Fusion Table can include some very powerful query features.
Unfortunately at the moment there isn't any information or support for adding a Fusion Table Layer in the Google Maps API v3 Tutorial. So, with the help of Soren from microformats.dk, I've put together this short tutorial which I hope will at least get you started creating a simple map with a Fusion Table Layer and a number of functions to query the data shown on the map.
Adding a Fusion Tables Layer to a Map

suppressInfoWindows: true
});
layer.setMap(map);
Examples:
Here are three examples of simple maps that have included Fusion Tables Layers. Each of the maps uses essentially the same javascript code. The only real difference in the three maps is the Fusion Tables id number - so that each map is using data from a different Fusion Table.
2474 Danish Churches
TFL Planned Bicycle Stations in London
The Beaches of Brazil
To get started creating your own map just copy and paste the html from any of the above maps and change the Fusion Table id number to the number of your own table.
WikiPedia Articles - This example from ubilabs has the added bonus of using the new Styled Maps function as well as a Fusion Table.
Querying a Fusion Tables Layer
Probably the most powerful feature of the Fusion Tables Layer in Google Maps is the ability to query the data in your table and show the results on a Google Map.
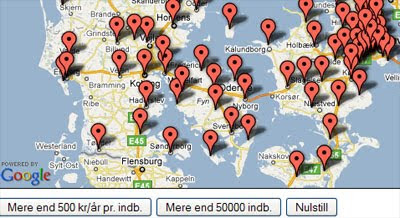
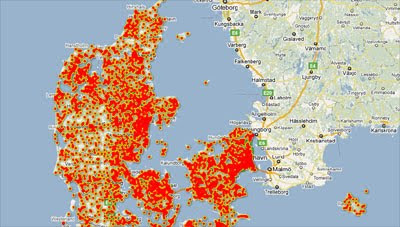
For example, have a look at this map of Public Library Funding in Denmark. The buttons at the bottom of the map let you query the data to show only those areas that spend more than 500 kr a year and areas with more than 50,000 citizens.
To query your Fusion Table and load the results onto your map you need to include a javascript function. The map above includes a function that queries the data to show only the entries in the table that have a number over 500 in the column headed 'Biblioteksudgifter2009'. Here is that function:
function updateMap() {
layer.setQuery("select kommune from 113681 where Biblioteksudgifter2009 > 500");
}
To call the javascript function the map uses a simple button.
Examples:
World Crime Rates - This example shows world crime and homicide rates. The map has included queries to view only countries with crime and homicide rates over certain figures.
mtbguru.com Slider Example - This example from mtbguru.com also uses a javascript function to query the data but uses a slider so that the user can adjust the variable to query.
It is possible to add more than one condition to a query. This map includes a time-line that allows the user to choose to view map markers relevant to ten year periods.
The query therefore needs two conditions. In the example below the function 'update' will load all the map markers that have a date bigger than 1900 and smaller than 1911.
function update() {
layer.setQuery("select Lat from 191236 where Date > 1900 and Date < 1911
}
I hope that this very brief tutorial provides you with enough information to help you get started creating your own Google Maps from Fusion Tables.
If you do create a map don't forget to submit the results to Google Maps Mania!
_____________
Map developers can use a Fusion Table to store location, line, polygon and associated data that they wish to display on a Google Map. Fusion Tables support an SQL like query language, which you can use to filter the features shown on a map. This means that a map developed from a Fusion Table can include some very powerful query features.
Unfortunately at the moment there isn't any information or support for adding a Fusion Table Layer in the Google Maps API v3 Tutorial. So, with the help of Soren from microformats.dk, I've put together this short tutorial which I hope will at least get you started creating a simple map with a Fusion Table Layer and a number of functions to query the data shown on the map.
Adding a Fusion Tables Layer to a Map
- To add a Fusion Table to your map you need to ensure that the Fusion Table is set to public or to unlisted. To do this click on the 'Share' button in Fusion Tables and set the 'Visibility Options' to 'Public' or 'Unlisted'.

- To add the Fusion Table to your map you need to know the id number of your table. The id number is the number at the end of the URL address of your Fusion Table. Here is an example of adding a Fusion Table Layer with an id number of '185419':
suppressInfoWindows: true
});
layer.setMap(map);
Examples:
Here are three examples of simple maps that have included Fusion Tables Layers. Each of the maps uses essentially the same javascript code. The only real difference in the three maps is the Fusion Tables id number - so that each map is using data from a different Fusion Table.
2474 Danish Churches
TFL Planned Bicycle Stations in London
The Beaches of Brazil
To get started creating your own map just copy and paste the html from any of the above maps and change the Fusion Table id number to the number of your own table.
WikiPedia Articles - This example from ubilabs has the added bonus of using the new Styled Maps function as well as a Fusion Table.
Querying a Fusion Tables Layer
Probably the most powerful feature of the Fusion Tables Layer in Google Maps is the ability to query the data in your table and show the results on a Google Map.
For example, have a look at this map of Public Library Funding in Denmark. The buttons at the bottom of the map let you query the data to show only those areas that spend more than 500 kr a year and areas with more than 50,000 citizens.
To query your Fusion Table and load the results onto your map you need to include a javascript function. The map above includes a function that queries the data to show only the entries in the table that have a number over 500 in the column headed 'Biblioteksudgifter2009'. Here is that function:
function updateMap() {
layer.setQuery("select kommune from 113681 where Biblioteksudgifter2009 > 500");
}
To call the javascript function the map uses a simple button.
Examples:
World Crime Rates - This example shows world crime and homicide rates. The map has included queries to view only countries with crime and homicide rates over certain figures.
mtbguru.com Slider Example - This example from mtbguru.com also uses a javascript function to query the data but uses a slider so that the user can adjust the variable to query.
It is possible to add more than one condition to a query. This map includes a time-line that allows the user to choose to view map markers relevant to ten year periods.
The query therefore needs two conditions. In the example below the function 'update' will load all the map markers that have a date bigger than 1900 and smaller than 1911.
function update() {
layer.setQuery("select Lat from 191236 where Date > 1900 and Date < 1911
}
I hope that this very brief tutorial provides you with enough information to help you get started creating your own Google Maps from Fusion Tables.
If you do create a map don't forget to submit the results to Google Maps Mania!
_____________


Comments
The only thing I've noticed is that when you get to around 300-400 markers (I'm not sure of the exact figure) the marker changes from the normal default marker to the little red dot markers.
Try posting your question the the Google Maps API v3 Google Group.
http://groups.google.com/group/google-maps-js-api-v3
1. Check that you have made the table 'public' or 'unlisted'
2. In this function - the field name or name of the column is 'kommune' - just experiment with changing it to your other column titles:
function updateMap() {
layer.setQuery("select kommune from 113681 where Biblioteksudgifter2009 > 500");
}
Check out the source code of this map
http://mappybirthday.appspot.com/
If you look at the line that starts:
var content =
you can see how I've appended the html to the url to create a clickable link.
I'm currently doing a store-locator using fusiontables querying the db with select dealer from xxxxx where city = 'stockholm'. It works fine but I have no idea of how to fitBounds() on that data. You have any suggestion of where to look? Been googling for hours but to no avail :(
Warning: there is an error now in some of those examples so that the info windows now aren't opening. I think there is a problem with local & global variables.
I'm sure someone else contacted me with a similar query about fitBounds(). I think they couldn't find an answer either and decided to work with App Engine (and the app engine data store) instead.
Sorry I can't be more help.
I'm using mouseEvent.latLng instead of mouseEvent.position, and I'm creating the InfoWindow once in the initializeMap function, and then calls iw.setPosition() and iw.setContent(), instead of recreating the object on each popup.
use fusion tables and much more geo content and online services
http://www.cartologic.com/cartoview/cloud.aspx
you can test the application on
http://cartoviewdemopage.appspot.com/cartocloud/index.html
However, I have one nagging question - all the data in the examples are either historical or static.
Is there a way to update the maps dynamically with live data - for e.g. I'm tracking users in different countries the numbers are changing constantly and I would like a intensity map to display that - is that possible? considering the data resides on Google Cloud
Do you happen to know how to show the data from the table as well as select it from a button?
So if you click a button to display the markers, it will show a list of the markers details below the map.