City Tree Scores
American Forests want to give every neighborhood in the USA a Tree Equity rating. The number of urban trees and the amount of tree cover in cities in the United States is often very closely tied to the distribution of income and race. Trees are usually very sparse in low income areas. On the other hand neighborhoods with lots of trees and tree cover are very often the most expensive areas in which to live.
A lack of trees and tree cover in cities is one of the biggest causes of urban heat islands. Urban heat islands are areas of towns and cities which can become unbearably hot, especially on days with extreme heat. These areas can often become 10-20 degrees warmer than other areas in the very same city. Urban heat islands tend to occur in areas with the densest built environments and with very little tree canopy cover.
American Forests has developed a methodology for rating city neighborhoods based on the level of tree canopy cover and the local population density. The American Forest Tree Equity Score rates individual neighborhoods out of 100 to show cities how well they are delivering equitable tree canopy cover to their residents.
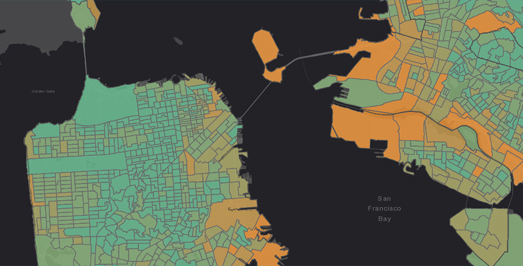
Currently American Forests has piloted their Tree Equity Score in the San Francisco Bay Area, Rhode Island and Maricopa County. The Tree Equity Score interactive map allows you to explore the ratings given to each neighborhood in these piloted areas. On this map individual neighborhoods are colored based on their Tree Equity Score. If you click on an individual neighborhood on the map then you can view data on the amount of current tree canopy cover and the demographics of the local population.

American Forests are not the only organization currently mapping the amount of tree canopy cover in American cities. Google is also working on ways to automatically assess the amount of tree cover in urban areas. Their Tree Canopy Lab is an interactive map which visualizes tree canopy cover in the city of Los Angeles. The map is designed to show the current tree canopy coverage in the city and to help identify where new tree planting efforts are most needed.
The Tree Canopy Lab map allows you to see the level of tree
canopy coverage in different neighborhoods in L.A. alongside
demographic data, such as population density. Using the map it is possible to quickly identify where the most people are likely
to be living in urban heat islands and where new tree canopy cover is
most needed in the city.


Comments