How to Create Grid Maps - Part Two
Creating hexagon grid maps is very straightforward with Leaflet. What follows is a quick tutorial explaining how to create this death penalty Grid Map.
We can make a quick start to the map by following the Leaflet Choropleth Map tutorial. Once you have the Leaflet Choropleth map, from the Leaflet tutorial, up and running all you have to do is create the hexagon shaped polygons for the US states and save it as a GeoJSON file.
Again you can cheat here and just grab the state polygon data from the CartoDB Bee Loss map. The data is provided in a table view with a neat little button to download the data as a GeoJSON file. Download the data and point your Leaflet Choropleth Map to your new GeoJSON file instead of the 'states.js' file in the original tutorial map.
We don't want the underlying map tile to appear on our map. So simply delete the following part of the html (which loads the map tiles):
Essentially that's all there is to it.L.tileLayer('http://{s}.tiles.mapbox.com/{id}/{z}/{x}/{y}.png', { id: 'examples.map-20v6611k', attribution: ... }).addTo(map);
However it would be nice to actually visualize some data on our hexagon grid map. This is easy for a simple true or false state map.
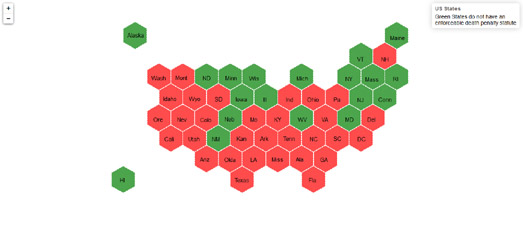
In my example Grid Map I've created a map which shows which states have an enforceable death penalty. To do this I simply created two separate GeoJSON files; one including the hexagon shaped polygons for states with the death penalty and another with the polygons for the states without the death penalty. It is then a simple matter of applying a different style to each set of polygons (green for states without the death penalty and red for those states with the death penalty).
It is would also be nice to add labels to our polygons so that the map's users can easily see which polygon represents each state on the map. To do this I used the leaflet-label plug-in. It is then just a matter of creating a label at the center of each polygon (to save doing this yourself you can just copy & paste the label variables from my example map).
That's it - you should now have a simple hexagon grid map of the United States, showing which states have an enforceable death penalty statute and which states don't.


Comments