Fun With OpenStreetMap
If you are stuck at home and looking for interesting things to do then you could try having some fun with OpenStreetMap. Using the three simple to use mapping tools listed below you can map your local neighborhood as a funky small 3D world, as a ridgeline joy-plot or as a radial map poster. All three tools are built on freely available OpenStreetMap data.
At the current time it might seem that your whole world consists of only your immediate environment. If you feel confined to just a few local streets then why not create a neighborhood globe. Little Big City is a fun WebGL experiment which you can use to create a small world based on OpenStreetMap data. Pan the inset map on Little Big City and you can view a little city made big on a small 3D globe.
The globe visualizes buildings, roads and water from OpenStreetMap on top of a small 3D globe. A radius control allows you to change the scale of the map data shown on the map. Increase the radius and you can view a slightly bigger small 3D globe. The map itself is initially zoomed in on Manhattan. It can be a little little time consuming to pan the map to a new location. You can cheat if you know the latitude and longitude of the location you wish to make into a little big city.
You can create a more conventional, but still beautiful, map of your neighborhood using Hans Hacks' Figureground Posters tool. Figureground Posters is an easy to use tool for creating map posters using OpenStreetMap data.
To create your poster simply click on the Figureground Posters interactive map to select the location that you wish to work with. You can then select a size for the area that you want to map. Figureground Posters creates circular maps so just choose the radius size that you wish to map (up to 2000 meters). When you are happy with your chosen location and radius size click 'Make Poster'. Figureground Posters will then create a simple map of your selected area using the building footprint data from OpenStreetMap.
Once you've created your map you can add a place-name (or any other text to your map). You can also choose between showing your map as black building footprints on a white background or white building footprints on a black background. That's it. You can now download your finished map poster as either a SVG or PNG image.
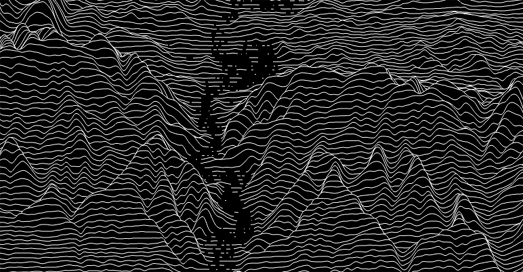
Peak Map is another fantastic and fun interactive tool for making unique maps. Peak Map can help you easily create a joy-plot map for any location on Earth. To create your own joy-plot map you just need to center Peak Map on your chosen location and a very artistic elevation profile will be generated automatically by this brilliant map tool.
Joy-plots (or ridgeline plots as they are sometimes called) are inspired by Joy Division's famous album cover for their Unknown Pleasures record. Since the 1970's the Peter Saville designed cover for Unknown Pleasures has become an iconic image. The original cover was inspired by a visualization of the radio waves emitted by a pulsar, which was published in the Cambridge Encyclopedia of Astronomy. In data science a visualization which is inspired by this radio waves graph is often called a 'joy-plot' in acknowledgement of the iconic album cover. Over the years a number of maps have used ridgeline plots or joy-plots to visualize different types of data, often to show population density or to visualize elevation.
Now you can also make your own ridgeline plots for any location in the world using Peak Map.
At the current time it might seem that your whole world consists of only your immediate environment. If you feel confined to just a few local streets then why not create a neighborhood globe. Little Big City is a fun WebGL experiment which you can use to create a small world based on OpenStreetMap data. Pan the inset map on Little Big City and you can view a little city made big on a small 3D globe.
The globe visualizes buildings, roads and water from OpenStreetMap on top of a small 3D globe. A radius control allows you to change the scale of the map data shown on the map. Increase the radius and you can view a slightly bigger small 3D globe. The map itself is initially zoomed in on Manhattan. It can be a little little time consuming to pan the map to a new location. You can cheat if you know the latitude and longitude of the location you wish to make into a little big city.
You can create a more conventional, but still beautiful, map of your neighborhood using Hans Hacks' Figureground Posters tool. Figureground Posters is an easy to use tool for creating map posters using OpenStreetMap data.
To create your poster simply click on the Figureground Posters interactive map to select the location that you wish to work with. You can then select a size for the area that you want to map. Figureground Posters creates circular maps so just choose the radius size that you wish to map (up to 2000 meters). When you are happy with your chosen location and radius size click 'Make Poster'. Figureground Posters will then create a simple map of your selected area using the building footprint data from OpenStreetMap.
Once you've created your map you can add a place-name (or any other text to your map). You can also choose between showing your map as black building footprints on a white background or white building footprints on a black background. That's it. You can now download your finished map poster as either a SVG or PNG image.
Peak Map is another fantastic and fun interactive tool for making unique maps. Peak Map can help you easily create a joy-plot map for any location on Earth. To create your own joy-plot map you just need to center Peak Map on your chosen location and a very artistic elevation profile will be generated automatically by this brilliant map tool.
Joy-plots (or ridgeline plots as they are sometimes called) are inspired by Joy Division's famous album cover for their Unknown Pleasures record. Since the 1970's the Peter Saville designed cover for Unknown Pleasures has become an iconic image. The original cover was inspired by a visualization of the radio waves emitted by a pulsar, which was published in the Cambridge Encyclopedia of Astronomy. In data science a visualization which is inspired by this radio waves graph is often called a 'joy-plot' in acknowledgement of the iconic album cover. Over the years a number of maps have used ridgeline plots or joy-plots to visualize different types of data, often to show population density or to visualize elevation.
Now you can also make your own ridgeline plots for any location in the world using Peak Map.


Comments