Global Warming and the Climate
Roofray

Have you ever thought about adding solar panels to your house? Roofray can help you decide. Roofray is an amazing tool built on Google Maps that can calculate the solar energy potential of your house.
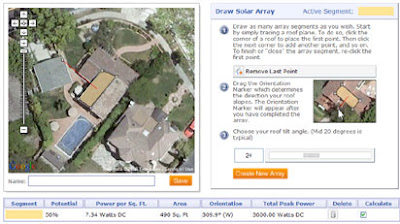
To do this you start by simply tracing a a polygon on top of the Google Map satellite image of your house. When you have traced your roof you then drag a marker on the map to show the direction your roof slopes. The next step is simply to enter the angle of your roof tilt.
Once you have entered your details Roofray calculates your month-to-month photovoltaic output levels based on your coordinates and regional characteristics such as the average weather cycle, cloud cover, surface albedo, and the orientation and area of your solar array.
Check out the video below for more information:
Global Sea Level Rise Map

This sea level rise map provides a visually striking view of which areas in the world might be flooded if global warming continues. It is possible to select the seal level rise you wish to view from a simple drop down box. The map will then overlay map tiles to show which areas of land would now be under water.
After using this map you will probably want to visit the Roofray map.
National Weather Service Enhanced Radar Image (dead link removed)

This map has nothing to do with global warming but it is a great way to view precipitation on Google Maps.
The National Weather Service uses radars to measure precipitation. This Google Map mash-up then displays the echo intensity (reflectivity) measured by those radars. The "reflectivity" is the amount of transmitted power returned to the radar receiver.
Base reflectivity images can be used to detect precipitation, evaluate storm structure, locate atmospheric boundaries and determine hail potential.
________________

Have you ever thought about adding solar panels to your house? Roofray can help you decide. Roofray is an amazing tool built on Google Maps that can calculate the solar energy potential of your house.
To do this you start by simply tracing a a polygon on top of the Google Map satellite image of your house. When you have traced your roof you then drag a marker on the map to show the direction your roof slopes. The next step is simply to enter the angle of your roof tilt.
Once you have entered your details Roofray calculates your month-to-month photovoltaic output levels based on your coordinates and regional characteristics such as the average weather cycle, cloud cover, surface albedo, and the orientation and area of your solar array.
Check out the video below for more information:
Global Sea Level Rise Map

This sea level rise map provides a visually striking view of which areas in the world might be flooded if global warming continues. It is possible to select the seal level rise you wish to view from a simple drop down box. The map will then overlay map tiles to show which areas of land would now be under water.
After using this map you will probably want to visit the Roofray map.
National Weather Service Enhanced Radar Image (dead link removed)

This map has nothing to do with global warming but it is a great way to view precipitation on Google Maps.
The National Weather Service uses radars to measure precipitation. This Google Map mash-up then displays the echo intensity (reflectivity) measured by those radars. The "reflectivity" is the amount of transmitted power returned to the radar receiver.
Base reflectivity images can be used to detect precipitation, evaluate storm structure, locate atmospheric boundaries and determine hail potential.
________________


Comments