Explore Your Local Census Data
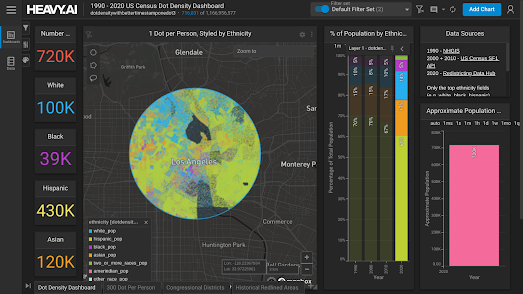
The 1990 - 2020 US Census Dot Density Dashboard is an impressive visualization of U.S. census data. Using HEAVY Immerse's interactive census dashboard you can not only explore a dot density map of the United States you can also actually drill down into the demographics of any defined area in the United States.
There are already a number of racial dot density maps which allow you to explore the racial and ethnic diversity of the American population. These maps include CNN's interactive map Race and Ethnicity Across the Nation, Esri's Race and Ethnicity in the US by Dot Density and Ben Schmidt's All of US.
Where the new US Census Dot Density Dashboard improves on these earlier maps is in its searchability. Using the polygon, polyline or lasso drawing tools provided you can define your own area on the map to view a breakdown of the local racial and ethnic demographics. Draw an area on the map and you can view a racial dot density map for your selected area and a breakdown of the numbers of the White, Black, Hispanic and Asian populations living in that area. An interactive chart also provides you with the percentages of the different ethnic groups at the time of each of the last four censuses.


Comments