If the Romans did Data Visualization
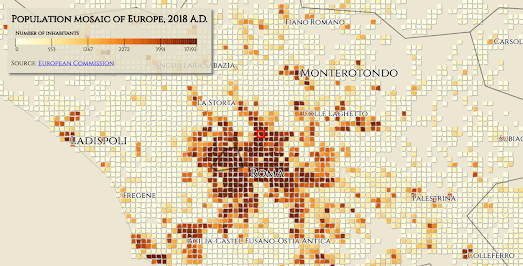
If you've ever wondered how the ancient Romans might have visualized population density then you might like Gridviz - Mosaic Style. Gridviz - Mosaic Style is an interactive map which visualizes European population data in the style of a Roman mosaic.
For clarity I must point out that this interactive map does not show population density in Europe as it was during the Roman Empire. This is actually a map of the current population density of Europe visualized in the style of a Roman mosaic floor - using data from the European Commission.

On this map individual tiles are colored to show the number of people living in that area. As you zoom out on the map the tiles represent ever larger equal areas of Europe. Gridvis - Mosaic Style is an interesting way to visualize population density in Europe. I also can't help thinking that the map could be of great use to any map fanatics who are thinking of redecorating their bathrooms.

You can view a more traditional map of European population density on the EU Population 2011 by 1km Grid interactive map. On this map Dan Cookson has visualized the population of the European Union at the 1km square level.
The EU Population 2011 by 1km Grid visualizes the number of people living in each square kilometer of the whole EU. You can hover over individual 1km squares on the map to view the total number of people living in that square. If you zoom in on individual cities the map reveals the most densely populated areas and also the outlying satellite commuting towns and suburbs.
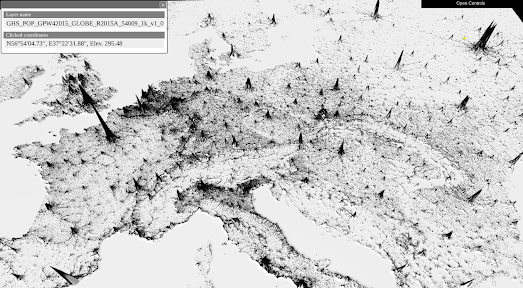
You might also be interested in this 3D Global Human Settlement visualization of European population density. This map provides a 3D view of Europe's most densely populated areas as population mountains.
If you want to view population density across the whole world then I recommend the SEDAC Population Estimator (GPWv4). This interactive map uses NASA's Earth Observing System Data and Information System (EOSDIS) data to show where the world's population lives. The SEDAC Population Estimator map includes a tool to draw an area on the map to see an estimate of the population that lives there.


Comments