The Population Density of West Coast Cities
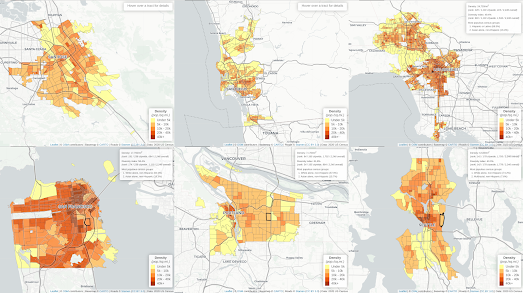
A couple of days ago Maps Mania featured Nat Henry's 15-Minute Map of Seattle. Nat has also created interactive maps which visualize the population density of the West Coast’s six largest cities. These Population Density maps color census tracts in each city based on the local population density (population per square mile).
Nat's population density maps use data from the 2020 census to show which census tracts in each city have the highest and lowest population density. You can hover over individual tracts on each map to view the exact population/square mile and to see how the tract ranks (in terms of population density) compared to all the other census tracts in the city and all the census tracts in the West Coast's six largest cities. According to Nat's analysis "San Francisco contains eight of the top 10 densest census tracts" in all of the six largest West Coast cities.
Nat has also used 2020 census data to map the most populous racial / ethnic group (and second most populous group) in each census tract in the six featured cities. He has also used the Simpson Diversity Index to map the racial diversity in each tract in all six cities. On these racial diversity maps census tracts colored red score low on the diversity index (meaning a lot of the population are of the same racial / ethnic group) and census tracts colored blue score high on the diversity index (the population is evenly divided among racial / ethnic groups).


Comments