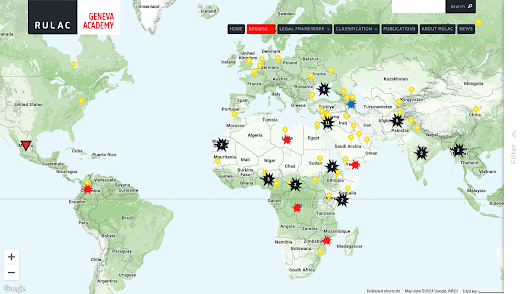
In 2024 the specter of military conflicts haunts the world. Israel is engaged in conflict in Gaza, Russia continues its illegal invasion of Ukraine and the Syrian civil war is now in its thirteenth year. It should be a matter of extreme shame that there are so many organizations who feel the need to publish interactive maps dedicated to tracking the progress of military action around the globe.
The Geneva Academy's The Rule of Law in Armed Conflict Map monitors and plots armed conflicts around the globe. The map currently shows the locations of more than 110 armed conflicts, including the military occupation of Palestine by Israel and the occupation of parts of Ukraine by Russia.
The Rule of Law in Armed Conflicts (RULAC) online portal has been mapped armed conflicts around the world since 2007. The map currently shows that at least "55 states and more than 70 armed non-State actors" are presently involved in armed conflicts.
If you click on the yellow country markers on the map you can discover which conflicts the selected country is currently involved in. For example if you click on the United States the map reveals that the US is presently involved in "airstrikes in Iraq and Syria" and is "also undertaking strikes against Islamist militants in Somalia, Pakistan, Libya and Yemen."
According to the International Institute for Strategic Studies (IISS) the intensity of conflicts around the world increased last year with the number of people dying in these conflicts increasing by 14% year-on-year.
The IISS is an international research institute (or think tank) focused on global security, political risk, and military conflict. The
IISS Conflict Trends Map plots the fall and rise of conflicts around the world based on the result of the institute's annual
Armed Conflict Survey. The interactive conflict trends map plots five main criteria: troop deployments, violent events, fatalities, the number of internally displaced persons and the number of refugees.
The map also includes a timeline control which allows you to track conflicts in countries around the world over time. Press the play button on this timeline and you can view an animated choropleth layer visualizing the progress of global conflicts for the years 2014-2023.
The Center for Preventative Action's
Global Conflict Tracker is another interactive map which tracks conflicts around the world. The Center for Preventive Action (CPA) is a think tank based in Washington, D.C., affiliated with the Council on Foreign Relations. It has a specific focus on conflicts which affect 'U.S. interests'.
The Global Conflict Tracker allows you to filter the conflicts shown on the map by status (worsening, unchanging or improving). The map can also be filtered to show conflicts which have a 'critical', 'significant' or 'limited' impact on the United States. If you click on any of the conflicts shown on the map you are taken to the CPA's page on the conflict, which includes background information, a summary of concerns and news of any recent developments.
The
ACLED Conflict Severity Index (from the The Armed Conflict Location & Event Data Project) uses four different indicators to assess and rank the complexity and severity of conflicts in countries across the world. Based on violence measured in countries around the globe in 2022 the Index identified 46 countries and territories which were experiencing severe levels of conflict.
You can explore Conflict Severity Index rankings for individual countries and the 46 countries identified with severe levels of conflict on ACLED's interactive map (based on 2022 conflicts). The map includes a choropleth layer which shows the number of incidents of political violence in each country. In 2022 political violence was seen in nearly every country and in many countries the incidents and number of incidents were considered severe by the ACLED. The ACLED has yet to publish it 2023 report.


Comments