⅓ of Rafah’s Buildings Destroyed

Bloomberg has analysed satellite imagery of the Palestinian city of Rafah and determined that Israel has damaged or destroyed about 32% of the region's buildings.
In How the Israel-Hamas War has Reshaped Rafah in Gaza Bloomberg presents a satellite image of the Palestinian city. As you scroll through the article a layer is superimposed on top of this satellite view to show buildings which have been damaged (in orange) and tents or other new structures (in yellow). As you scroll south across the region it is impossible to not be shocked by the devastating destruction of the region by the Israeli attacks.
The Bloomberg analysis used machine learning to compare two satellite images of the region - one image captured in November of last year and a more recent satellite image captured at the end of March. The machine learning model was trained to look for tents and for new structures. In the article Bloomberg also reports that 'Across the entire Gaza Strip, about 56% of buildings have been damaged'.
The Guardian has also used satellite imagery and open-source evidence to map the mass destruction of buildings and land in Gaza. In January the newspaper published a story-map How war destroyed Gaza’s neighbourhoods, which guides you through satellite imagery of three neighborhoods in Gaza (Beit Hanoun, al-Zahra and Khan Younis) documenting the destruction of civilian infrastructure by Israel.
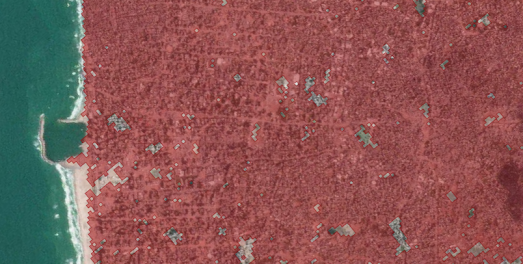
The destroyed buildings in the satellite imagery in The Guardian's map are colored red. However, as the map automatically pans over Gaza, it quickly becomes apparent that it would have been easier for The Guardian to color in the undestroyed buildings as there is very little civilian infrastructure left in the three neighborhoods.
As well as the satellite imagery of Israel's destruction of civilian infrastructure the map is illustrated with video evidence of the Israeli attacks. This destruction of civilian infrastructure by Israel includes bombed schools, mosques, hospitals and people's homes. So far 1.9 million people have been forced to leave their homes in Gaza and, according to The Guardian, the scale of destruction carried out by Israel has "led some experts to describe what is happening in Gaza as 'domicide', ... widespread, deliberate destruction ... preventing the return of displaced people."

In November a researcher at UCL's CASA released an interactive mapping tool to help researchers and news agencies "estimate the number of damaged buildings and the pre-war population in a given area within the Gaza Strip". The Gaza Damage Proxy Map is based on an earlier tool which was developed to estimate damage caused by Russia in Ukraine.
The Gaza Damage Proxy Map colors individual buildings in the Gaza Strip to indicate the probability that the building has suffered damage since October 10, 2023. If you use the map's drawing tool you can highlight an area of the Gaza Strip on the map. The Gaza Damage tool will then automatically estimate the number of damaged buildings in the highlighted area and the estimated affected population. The percentage of the buildings damaged in the area is also calculated for you. If you select individual damaged buildings on the map you can view information on the date of the damage and view a link to the source media for the damage report.
The Gaza Damage Proxy map uses Synthetic Aperture Radar imagery captured by satellites to detect damaged buildings. By measuring the change in the intensity of these radar waves since before the Israeli attacks on Gaza it is possible to estimate the probability that individual buildings have been damaged. Damage points from the UN Satellite Office (UNOSAT) have also been used to validate the accuracy of the damage detection algorithm used by the map. The map itself also includes an optional layer which adds geo-located footage of strikes and destruction in Gaza as triangular map markers.
You can learn more about the methodology used to estimate building damage in Gaza in the Bellingcat article, A New Tool Allows Researchers to Track Damage in Gaza.


Comments