Sunday, August 31, 2014

The Maps of the Week


This week ProPublica released an impressive mapped visualization of the effect of climate change and oil & gas exploration in the state of Louisiana.

Southern Louisiana is losing 16 square miles a year to the Gulf of Mexico. At the heart of ProPublica's map, Losing Ground, is a series of timeline visualizations of historical aerial imagery. These timelines allow you to observe the loss of land in Louisiana by comparing present day aerial imagery with aerial imagery going back to the 1930's.

Accompanying the aerial imagery are a series of interviews of people living and working in the affected areas. These interviews are supported by audio files and photos. In combination the audio, photos, interviews and aerial imagery of Louisiana's land loss provide a powerful account of this ongoing environmental disaster.


Last year Dave MacLean, from the GIS Faculty at the Centre of Geographic Sciences of the Nova Scotia Community College (NSCC), released a map of photos taken from the International Space Station.

Our World from the ISS is an ESRI map of photos, taken from the ISS posted by @Cmdr_Hadfield and @AstroMarshburn on Twitter. The map allows you to view thumbnails of some truly amazing photos of Earth taken from the ISS.

Dave MacLean has now released a new map covering photos from the ISS Missions 40 and 41. All the photos are mapped to the locations shown in the views of the Earth depicted. The map may not break any new ground in the world of interactive cartography but it definitely wins the weekly award for the most shared map on social media.


This week I was also quite impressed by the Street View treasure hunt game The Day Google Street View Stood Still.

This Street View game uses the Web Audio API to provide audio clues to help you find a number of hidden items. In the game you are teleported to a Street View location somewhere in the world. The object of the game is to follow the audio clues to find objects nearby. The game is a kind of 'hot or cold' searching game, as you get closer to the correct destination the audio clues get louder. If you travel in the wrong direction then the sounds becomes quieter.

The Day Google Street View Stood Still has a number of levels. When you finish a level you are told how many steps you have taken and how long it took you to reach the correct destination. If you make one of the top ten quickest times you can even add your name to the high-score table.

Mapping Events


MapTiming HASH is a new application designed to help you find upcoming events on a map. Currently the map is populated with the dates and times of church services in Belgium. However anyone can add an event to the map and the application is not restricted to mapping events in Belgium or to religious services.

Over the years there have been many attempts to crack the events mapping market. One of the biggest hurdles to overcome when creating a map of upcoming events is populating the application with enough events. Like MapTiming Hash you can help to populate an events map by crowd-sourcing your event database, by allowing users to add events to the map.

Crowd-sourcing events data means surmounting the Catch 22 problem of events mapping - you need users to add events to the map but you need events on your map to get users. The problem is how do you reach a critical mass where enough users add events to the map to make the map useful enough to attract users in the first place.

Traditionally events mapping websites have overcome this problem of having enough events on the map to attract users by using third-party events services such as EventBrite and Upcoming. MapTiming Hash has a different solution. The hook for adding events to MapTiming Hash is that you can then use the dynamic URL of the event to share the event with friends. You can even use an iframe to add the map of your added event to your own website. Therefore if you are an organization which has an upcoming event you can use MapTiming Hash to create and share a map of your event.

Another very useful feature of MapTiming Hash is the events search features. Like most event mapping websites you can search for events on MapTiming Hash by location and by date. However MapTiming Hash also uses hash tags to organize types of event. When adding events to the map users are encouraged to use keywords (beginning with a '#') in the description of the event. These hashtags can then be used by users of the map to find events with a specific tag. For example you can filter the events shown on the map by entering 'aanbidding' by clicking on the hashtag button. Do this and the map will filter the events to only show upcoming church services tagged with 'aanbidding'.

Saturday, August 30, 2014

The Bárðarbunga Depth Map
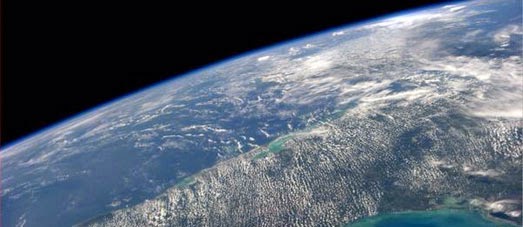

Quakes 3d is an interesting animated mapped visualization of seismic activity near the Bárðarbunga Volcano in Iceland over the last two weeks.

The map animates through two weeks of earthquake activity, visualizing a heat map of seismic activity on the surface, overlaid on top of an aerial image of the area. At the same time the same data is plotted as a depth map beneath the map layer.

You can pause the animated playback of the earthquake data at any time and you can also switch between a map and aerial view of the area around Bárðarbunga.

Also see: Mapping Seismic Activity at Bárðarbunga

Friday, August 29, 2014

The Photo Map from Outer Space


Last year Dave MacLean, from the GIS Faculty at the Centre of Geographic Sciences of the Nova Scotia Community College (NSCC), released an amazing map of photos taken from the International Space Station.

Our World from the ISS is an ESRI map of photos, taken from the ISS posted by @Cmdr_Hadfield and @AstroMarshburn on Twitter. The map allows you to view thumbnails of the posted images. If you click on the thumbnail the photo will then open in a new browser window.

Dave MacLean has now released a new map covering photos from the ISS Missions 40 and 41. All the photos are mapped to the locations shown in the views of the Earth depicted. The map also shows the live position of the International Space Station.

Story Maps with Mapbox GL


Yesterday I was impressed by two story maps created with Mapbox GL. The Mapbox Blog published a very neat map highlighting some of the details in their new satellite imagery for Madrid airport. The Guardian  also used Mapbox GL in a feature on immigration in Texas (to see the map scroll down to the section headed 'The impact of Migrants on Falfurrias').

Both of these maps make use of Mapbox GL's panTo and rotateTo functions to seamlessly pan and spin the map to new locations.

I was particularly impressed with the Mapbox Blog map. This map cleverly uses the height of an overlaid div element to work out when to pan and zoom the map to show new locations. As you scroll down this map sidebar element the map automatically updates to show you the relevant location.

I was so impressed I had to steal the code. I used the Mapbox Blog's map code to make this little tour of the London Olympic Park.

Both The Guardian and Mapbox Blog maps include the option to gracefully fallback to an alternative Mapbox map for browsers which don't support Mapbox GL. I haven't done that with my map - so to view the map you will have to use a modern browser which supports Web GL.

Mapbox Satellite Update


Mapbox has begun adding new satellite imagery from Worldview-3. Worldview-3 was launched two weeks ago and is already providing unrivaled satellite imagery of the Earth, at 31 centimeter (12 inch) resolution.

Mapbox has now begun to add satellite Imagery from Worldview-3 to Mapbox satellite view. The first update to the imagery is just a small 3 km2 area around Madrid’s airport. This small update is enough to see that Worldview-3 can be used by Mapbox to provide detailed satellite imagery which is at least on a par with plane captured aerial imagery.

The Mapbox blog has a really nice map of the new satellite imagery, which is almost as impressive as the imagery itself. The map highlights some of the detail captured by Worldview-3 at Madrid airport using the new Mapbox GL mapping platform.

The map uses Mapbox GL's panTo, flyTo and rotateTo methods to seamlessly pan and rotate the map to new locations. These location updates are fired by the user as they scroll through the map sidebar. As the user scrolls through the information provided in the map sidebar the map automatically pans and rotates to show the location being explored in the text.

Thursday, August 28, 2014

Louisiana is Losing Ground

Using historical aerial imagery from NASA and USGS, ProPublica has put together an impressive interactive mapped visualization of the effect of climate change and oil & gas exploration on the state of Louisiana.

Southern Louisiana is losing 16 square miles a year to the Gulf of Mexico. At the heart of ProPublica's map, Losing Ground, is a series of timeline visualizations of historical aerial imagery. These timelines allow you to observe the loss of land in Louisiana by comparing present day aerial imagery with aerial imagery going back to the 1930's.

For example, here is the area of Venice and West Bay as it looked in 1932:


Here's how the same area looks today:


Accompanying the aerial imagery are a series of interviews of people living and working in the affected areas. These interviews are supported by audio files and photos. In combination the audio, photos, interviews and aerial imagery of Louisiana's land loss provide a powerful report into this ongoing environmental disaster.

How Big is Africa?


Compera is a fun tool which you can use to compare the size of two different countries, states or cities.

Using Compera couldn't be easier. Simply select the two locations you wish to compare from two drop-down menus and you will be shown two maps of your selected locations, allowing you to easily compare their respective sizes. Compera also reveals how many times the larger location is than the smaller location, the size of each (in square kilometers) and  the populations of each.

The maps on Campera are created using D3.js, using map data from Natural Earth Data.

Wednesday, August 27, 2014

The Wikipedia Dot Map of the World


Wikipedia Worldview is an interesting visualization of geo-referenced Wikipedia entries. Using the application you can select a language and view a dot-map of the world created purely through the plots of all the locations of Wikipedia entries.

You can select to view a single language's Wikipedia entries or any combination of languages. A geo-referenced map of the world is then created from all the geo-tagged articles in the chosen language(s). When the map has been created you can even click on the map to link through to the selected Wikipedia article.


Mapping Wikipedia is a similar project from TraceMedia and the Oxford Internet Institute.

Using the Google Maps API Mapping Wikipedia allows you to view the geography of all geotagged Wikipedia articles in a number of different languages. It can also create maps based on the word count of articles, the date created, number of authors, and number of images.

If you are interested about how the map was created TraceMedia has provided an outline of the tools used in building the application.


WikipediaVision is an animated Google Map of real-time map edits to Wikipedia.

The map displays an information window for each edit, with the title of the article, the summary of the edit (if a summary was given), a link to the changes that were made to the article and the time the edit happened.

Minecraft Maps the World


The British Geological Survey has released a Minecraft world using the Survey's geology data of mainland Great Britain and surrounding islands.

You can download the BGS's world for Minecraft at the GB Geology with Minecraft page on the BGS website. This page also includes a Google Map which allows you to explore the BGS Minecraft world of Great Britain with Google's popular interactive mapping interface.

The BGS's Minecraft World uses data from the UK's Ordnance Survey on the world surface. The geology of Great Britain beneath the surface is also represented on the surface of the map and shown beneath the bedrock.


The British Geological Survey's Minecraft world is inspired by last year's Ordnance Survey Minecraft map. The UK's Ordnance Survey is charged with maintaining the UK's geospatial and cartographic data. This largely involves creating and publishing maps in paper and digital form and now also in textual cube form for Minecraft fans.

Minecrafting with OS OpenData is a Minecraft map of mainland Great Britain and surrounding islands that anyone can download and explore in Minecraft. The OS Minecraft world was built with OS OpenData, which is Ordnance Survey data that is freely available under an attribution-only license.

The OS Minecraft world of Great Britain consists of more than 22 billion blocks representing over 220,000 square kilometres. Each block in the world represents 50 square metres. To help you navigate this 3d world the Ordnance Survey website has published a list of Minecraft world co-ordinates to some well known UK locations.

The Ordnance Survey Minceraft Overviewer Map of the UK allows you to view this Minecraft map of the UK within a Google Maps interface.


Denmark's government has also released its free spatial data in a format which can be used with Minecraft. You can download the Danish Minecraft data at Danmarks Frie Geodata i en Minecraft.

The Danish Minecraft world is on a scale of 1:1, so it should take you a long time to explore the whole country. The Danish Minecraft world also includes 3d buildings so there is a lot of fun to be had navigating around Denmark's cities.


SparseWorld is creating huge Minecraft maps of New York and other cities around the world. These Minecraft worlds are  created using elevation, landcover and orthography data from USGS, 3d buildings from Google Earth and street mapping data from OpenStreetMap.

How to Tell Stories with Maps


School of Data has published a good round-up of narrative mapping platforms. The article includes a few examples of good story maps and explores some of the mapping libraries which can be used to create interactive maps to annotate or narrate a story.

Seven Ways to Create a Storymap reviews popular narrative mapping libraries such as Knight Lab's StoryMap JS, Esri StoryMaps and CartoDB's Odyssey.js. It even mentions my own story map demo created using waypoints.js with Leaflet, JourneyMap.

One of the examples listed in the School of Data article is new to me. LeafletPlayback is a very neat Leaflet library which allows you to animate GPS Tracks, in the form of GeoJSON objects, on a Leaflet map. You can see the library in action on this example map, which animates markers along four separate tracks. The map includes video type playback controls which also allow you to control the playback of the animated marker tracks.

The LeafletPlayback library provides a great way for developers to animate a journey on a map. Using the library you can animate a marker along a polyline, with the marker's movement synchronized to a time-stamp in your GeoJSON object.

Tuesday, August 26, 2014

Sounds on Street View - The Game


Back in March I made a little demonstration map using the Web Speech API. The Speaking Map allows you to click anywhere on a Google Map to listen to the address clicked on being spoken by your computer. The Web Speech API isn't widely supported yet - so to hear the map talk you will have to use a compliant browser. In this case you will probably need to view the Speaking Map in Chrome.

At the time I did wonder if anyone else might use the Web Speech API to create a map which was a little more useful. Internet agency Netro has now created a Street View game using the Web Audio API. This game might not be any more useful than my little demo map, but it sure is a lot more fun.

In the game you are teleported to a Street View location somewhere in the world. The object of the game is to follow the audio clues to find objects nearby. The game is a kind of 'hot or cold' searching game, as you get closer to the correct destination the audio clues get louder. Go in the wrong direction and the sound becomes quieter.

The Day Google Street View Stood Still has a number of levels. When you finish a level you are told how many steps you have taken and how long it took you to reach the correct destination. If you make one of the top ten quickest times you can even add your name to the high-score table.

Hat-tip: Google Street View World

Dunkin' Donuts vs Starbucks


The Boston Globe has released a map of all the Dunkin' Donuts and Starbuck locations in the USA. In Dunkin’ Donuts Set for California Expansion the Boston Globe visualizes the dominance of each business in the areas where they were founded.

The map shows a higher density of Starbucks on the West Coast and a higher density of Dunkin' Donuts in the Northeast. However the map also shows how both companies are expanding across the country.

For this map the Boston Globe uses a similar approach to that taken in their recent Massachusetts Pedestrian Crashes map. Both maps include the option to explore hot-spots on the map, areas where the data shows interesting results. In the pedestrian crashes map the hot-spots option is used to explore and explain locations with abnormally high number of pedestrian crashes.

In the Dunkin' Donuts map the 'See hotspots' option takes you on a tour of some of the major cities and states to explore and examine the preponderance of Dunkin' Donuts and / or Starbucks outlets.

Source Maps and Supply Chain Mapping


These days more and more consumers care about the manufacturing conditions and the environmental impact of the physical products that they buy. They care about whether their manufactured goods are produced in safe working conditions and that the businesses pay a living wage.

Many consumers also care greatly about the conditions and environmental impact of the food and drink products which they consume. As a result of this consumer demand more and more companies are creating source maps. These are maps which show where businesses source the components for their physical products and where they source the ingredients for food and drink products.

French yogurt producers Les 2 Vaches has released a source map for their range of organic yogurts. This Google Map shows where all the yogurt ingredients are produced or grown. The map also shows where the ingredients are stored and prepared.

If you select a marker on the map you can click on the '+' icon to read more about the farm or company which produces an ingredient or product used in Les 2 Vaches. The map sidebar displays the ingredients used in the yogurt. If you select an ingredient the map highlights the companies and farms involved in producing the selected ingredient and a supply chain is displayed on the map to show how the ingredient makes it to the final product.


Businesses that want to create a source map can also use a narrative mapping platform, such as Esri's Story Maps or CartoDB's Odyessey.js. This is the route taken by T-shirt manufacturers Loomstate.

Loomstate has used Odyssey.js to create The Loomstate Difference, a narrative map which guides potential consumers through the manufacture of a Loomstate T-shirt, from the sourcing of materials to the finished product.

The map takes you on the production journey of a Loomstate t-shirt, from cotton farm to mill, from cotton to garment, from dying to printing, the map reveals the whole process of a t-shirt's manufacture.


SourceMap has being mapping product supply chains for a number of years. SourceMap is a crowd-sourced directory of supply chain and environmental footprint maps for thousands of different well known and lesser known products.

SourceMap can be a great resource for businesses, providing them with an easy way to create an OpenStreetMap showing where all their core materials are sourced. For consumers SourceMap provides a great way to research the supply chains of products to help them make more informed purchasing decisions.

Monday, August 25, 2014

Live Heat Mapping


Where Are All the CitiBikes is a real-time heat-map of the number of bikes currently available at CitiBike stations across New York.

Throughout a normal day bikes are constantly being borrowed and returned from CitiBike stations. This map uses data from CitiBike System Data to show the density of bikes at stations at the present time. Larger numbers of bikes at a station is shown on the map in red and a low number shows up as blue.


In Search of the Safest CitiBike Stations is another interesting visualization of New York's CitiBike scheme. This map shows the number of cycling related injuries around CitiBike stations.

The map presents a Voronoi diagram view showing areas around the closest CitiBike station. Each segment in the Voronoi diagram is then colored to represent the number of cycling related injuries reported between Jan 2013 and May 2014. You can click on the individual areas to view the total number of injuries reported.

The data itself does not relate to injuries suffered by CitiBike users but all cycling injuries reported to the police involving a Motor Vehicle. To date there have been no reported cycling fatalities from anyone riding a CitiBike borrowed bike.

Walk the Map


Here is another fun little Mapbox GL demo. The Walk Map allows you to navigate around a map using your cursor keys. That may not sound like a lot of fun but it is a rather neat demonstration of the Mapbox GL rotate event.

Using the up and down buttons you can move forwards and backwards on the map, while the left and right buttons allow you to rotate the map. The map rotation is fired by assigning a '+' or '-' value to the map heading every time the user clicks on the left or right mouse button.

This is the third Mapbox GL map I've seen since the introduction of Mapbox's new mapping library. You might also like to check out the Van Gogh Map (which uses images for map tile textures) and the birthplaces of Liverpool Football Club players map (which is a nice example of how to add markers and text labels).

The World of Fiction Mapped


LibrAdventures is a new Google Maps based literary atlas which allows you to explore locations across the globe in terms of their association with famous authors and works of literature.

Users can explore the literary atlas in a number of ways. You can search the atlas by individual author, by literary genre or by location. A good place to start exploring the atlas is the Index page, which provides a complete list of all the entries. The index can be ordered by author name, by year and by location.

Individual entries on the map provide detailed textual context and the option to view the location in Google Maps Street View. Many of the entries also provide YouTube videos or audio clips of adaptions of the literary texts discussed.


The LitMap is another intersting Google Map which allows you to explore the texts associated with locations around the world. The LitMap maps books by where the plots occur or the places that they are associated with.

The LitMap maps any kind of literature, both fiction and non-fiction, that can be associated with a specific geographic location. The LitMap includes an option for users to submit book locations to the map. 

The poet Robert Frost said that "All literature begins with geography". Poetry Atlas agrees and also believes that nearly everywhere on Earth, at some point, has had a poem written about it.

The Poetry Atlas has therefore created a Google Map to try and geotag as many poems as they can and also find poems for as much of the world as possible. If you know about a poem that isn't on the map you can e-mail it to Poetry Atlas and they will add it to the map.

For over seven years now Google Lit Trips has been plotting the character journeys undertaken in famous works of literature.

The site plots the journeys of characters and locations mentioned in a large number of literary texts. Google Lit Trips is designed with school students in mind. Each location plotted in an individual text includes information windows containing a variety of resources, including media, thought provoking discussion starters and links to supplementary information about the locations featured.

Sunday, August 24, 2014

Real-Time Earthquake Maps


It's been quite a day for big earthquake news, with two large earthquakes (magnitude 5.3 & 5.1) near the Bárðarbunga volcano in Iceland and an earthquake of 6.1 magnitude near American Canyon in California.

Perhaps unsurprisingly the USGS provides one of the best near real-time maps of earthquake activity. The Latest Earthquakes Map provides you with a number of options to view earthquake activity over the last 24 hours, the last week or the last month.

The map also allows you to overlay plate boundaries and US fault lines on the map.

The Ö-Files - Live Earthquake Map uses Google Maps and the Simile Timeline with a number of data sources to also provide a live map of earthquake activity around the world.

The map is updated every five minutes to show the latest reported earthquake and you can use the time-line to explore earthquakes over the last seven days. It is also possible to refine the results shown on the map based on the different data sources.

Another source for the latest earthquake activity is Stanford University's Quake-Catcher Network. The Quake-Catcher Network links participating laptops into a single coordinated network to detect and analyze earthquake activity.

Many laptops these days are built with accelerometers that are designed to protect your hard drive from damage. The accelerometer detects sudden movement and can switch the hard drive off so that the heads don't crash on the platters. The Quake-Catcher Network realized that they could create the world’s largest and densest earthquake monitoring system simply by using the data from accelerometers in the world's laptop computers.

QCN uses Google Maps to show the data collected from participating laptops and from participating desktop computers with USB sensors. The map also shows the latest USGS reported earthquakes.

The Maps of the Week


The Gaza War Map is a powerful visualization of the devastating effect of Israeli air strikes in Gaza. The map consists of a number of 360 degree panoramic Street Views taken in the Gaza Strip since the onset of the present conflict between Israel and Hamas.

You can navigate to each of the Street Views by using the thumbnail images or by selecting the markers on the map. As you pan around one of the custom Street View images a radar control on the map shows the direction of your current point of view. You can also right-click on a panorama to change the panorama's projection.


This week I also liked the Van Gogh Map, created with Mapbox GL and textures taken from Van Gogh paintings.

I originally posted the map because I thought it provided a neat example of how to add textures to map tiles in the new Mapbox GL. However the map seemed to strike a chord with Google Maps Mania readers and has been far and away the most viewed and shared map over the last seven days. For that reason alone it has to make it to this week's Maps of the Week round-up.

The map is also worthy of a second look. Since I wrote about the map on Thursday some work has been done on cleaning up the texture seams. 


If you like artistic looking maps then you might also like this Leaflet powered Fractal Map. Using the map you can pan around and zoom in on a number of beautiful fractal patterns.

The map includes a Leaflet hash library, which means that you can pan and zoom the map to find your favorite fractal patterns and then share the view by cutting and pasting the URL. The map is also a neat demo of using the Leaflet mapping platform with HTML5 canvas and Web Workers. You can explore how this is achieved on the map's GitHub page.

Saturday, August 23, 2014

Mapping the Minimum Wage


The Minimum Wage Map is a neat interactive map which allows you to compare the minimum and the average annual salaries (in a range of different occupations) of each U.S. state. If you mouse-over a state on the map you can view the state's minimum hourly wage rate, a yearly minimum wage rate and the average salaries of different occupations.

A number of South Eastern states have no state minimum wage law so the minimum wage in these states is $7.25, which is the federal wage baseline. A number of states also have state minimum wage rates set below the federal minimum wage. Employers in these states must also meet the federal wage baseline of $7.25. Washington has the highest minimum wage at $9.32, followed by Vermont on $8.73.

The map was created with Leaflet. Interestingly the map has dragging set to false - map.dragging.disable(); - which you don't often see implemented on interactive maps. This means that you can't pan around on the map. On this map the user really doesn't need to drag the map around, so disabling panning does seem a logical choice. If you click on the state the map automatically zooms in on the selected state. Clicking on the map again zooms out to show the whole of the United States.

Friday, August 22, 2014

Fracking Hell


This Global Flaring Visualization is an animated map showing nightly, infrared satellite detected natural gas flaring across the world.

For cost reasons oil producers frequently flare methane and other gases produced by oil wells rather than recover the gases. This flaring adds huge amounts of CO2 to the atmosphere and the gases themselves can often pollute the air.

The map uses data collected by NOAA’s Suomi NPP satellite to show a nightly global snapshot of natural gas flaring over the last five months. Identifiable hot-spots on the map include flaring from the Bakken shale formation in North Dakota and the huge natural gas flaring in Russia and the Middle East.

Mapping Strabo's Geographica


Recently Google Maps Mania reviewed the Hestia Project's Herodotus Timemap. Herodotus, sometimes known as the Father of History, was a fifth century Greek historian. In his 'Histories' Herodotus recounts the origins of the Great War between the Greeks and Persians and the rise of the Persian Empire.

The Hestia Project's Herodotus Timemap connects the text of the Histories with a Simile timeline to allow users to visualize geographical references in the Histories on a Google Map. Using the application you can read through the chapters of the Histories and view the locations of all the place-names mentioned in the text on the accompanying map.


If Herodotus was the 'Father of History' then the title 'Father of Geography' could be given to the Greek philosopher, historian and geographer Strabo. In the early days of the Roman Empire Strabo's 'Geographica' described the cultural and geo-political world of that time.

To accompany the publication of Duane W. Roller’s new English translation of Strabo’s 'Geography' the University of Cambridge Press has released an interactive map of all the locations mentioned in Strabo's Geographica.

The Strabo Map uses Mapbox to add place-name mentioned in the Geographica to an interactive map. If you purchase the e-text of the new translation you can click through on place-name links in the text to view the locations on the map. However the map itself is free, so you can explore the world as documented in Strabo's Geographica to your heart's content.

The map tiles used in the map are the same AWMC map tiles, as used in the Pleides gazette of ancient places.

Tracking Dr Who on Street View


The new season of Dr Who starts tomorrow. During his absence from our screens the Google Maps Street View car has been tracking the Tardis. The car has managed to capture a number of Street View shots of the Tardis while the Doctor has been enjoying his vacation time travelling around the UK.

I've put together a little slideshow of some of the Street Views of the Tardis on Google Maps. I was helped in this task by this Ordnance Survey Tardis Map showing the location of 73 police boxes in the UK.

My Dr Who map includes forward and back arrows so you can navigate through the different Street Views. If you make it to the end of the collectionyou can actually explore the inside of the Tardis on Street View.

The Worst Map of the Week


I don't usually criticize maps on this blog. Google Maps Mania is mainly concerned with interesting on-line maps and maps which are experimenting with new or original visualization techniques. This means I tend not to concentrate on the cartographic failings of the maps featured on Google Maps Mania.

Yesterday's Van Gogh map post is a good example of this. This map is never going to win any awards for excellence in cartography but the Van Gogh map is an interesting experiment in using the new Mapbox GL mapping platform. It could therefore be very useful as a demo map for any developers who are starting to explore Mapbox's new map library - so it gets no criticisms from me.

However cartographic critics do play an invaluable role in sharing and encouraging good cartographic practice. Kenneth Field's Cartonerd is a great blog for anyone who is interested in good and bad cartography. Kenneth's constructive criticisms of published maps are really informative and he regularly explores the common cartographic mistakes made in maps. This recent post on the Gaza Everywhere map is a great example of how Cartonerd's observations can actually lead to a map developer creating a better map.

I am going to make an exception today however, in my 'no criticism' policy, for a map by The Daily Telegraph which has really annoyed me. I'll let Cartonerd criticize the cartography if he wants - I want to concentrate on the map's horrible social prejudices.

The Daily Telegraph has mapped the 'best places' to live in England and Wales. To make this map The Telegraph has created its own 'index' based on five social and economic criteria. Average Weekly Incomes and Home Ownership levels make up two of these five criteria. Therefore the map places a huge weighting in its judgement of the 'best places' to live on areas having no poor people or people who don't own their own homes.

On first reading about these criteria my first thought was that The Telegraph was making a really nasty judgement in deciding where the better places to live are, assuming that if you have the choice it is better to avoid living anywhere near poor people. I then wondered a little about whether this judgement might actually be true. It is entirely possible that the nicer places to live become beyond the means of people without high incomes. The 'best places' to live attract more people and the market drives up the price of property and the area eventually becomes dominated by people with high incomes.

To be fair to the newspaper The Telegraph's assumption might be not that an area is better because it has no poor residents but that the better areas have higher incomes because they eventually become unaffordable to anyone without a high income.

To test this hypothesis I looked at the rankings for areas around where I live in East London. In The Telegraph map Redbridge is declared a far better place to live than Hackney. Hackney scores very low on the home ownership and average income levels while Redbridge scores very high on both criteria. Hackney is therefore declared a less nice place to live because it has too many poor people.

Given the choice however I don't think I'm alone in thinking that I would far rather live in Hackney than Redbridge. Hackney is a far more vibrant and exciting community than Redbridge, with far more options in terms of restaurants, night-life and cultural activities.

Herein lies one of the problems in The Telegraph's criteria for deciding where the 'best places' to live are. My experience is that areas with low income and home ownership levels are often the areas which are the most exciting to live. These are the areas, in cities in particular, which often attract the young, the artistic and the dynamic start-up companies looking for cheap rent.

In fact I look at The Telegraph's The Best Places in England and Wales and find that in the areas I know about I would far rather live in the places that The Telegraph claims are the worst places to live than in their 'best places'. But I guess that could be down to my own social prejudices and the fact that I don't necessarily despise people on low incomes.

Thursday, August 21, 2014

If Van Gogh Made Maps


Here's another little Mapbox GL created map. The Van Gogh Map uses a few images from Van Gogh paintings as textures for the map feature types.

Feature types on this map, such as water and different types of land cover, are made up of map tiles created with textures taken from Van Gogh paintings. The result is a map style which you probably wouldn't want to use very often but the map does serve as a neat demo of how easy it is to create interesting map styles with Mapbox GL.

This is the second Mapbox GL map I've seen this week. The first, Birthplaces of Liverpool Football Club Players, is a handy little demo map showing how to add markers with text labels in Mapbox GL.

A Serendipitous Stereographic Projection


Serendipity uses data from Spotify to show you the locations of two Spotify users who are listening to the same track at the same time. The map shows the locations of two users who have started listening to the same song on Spotify within a tenth of a second of each other, in different towns, cities, states, nations or timezones.

The thing I most like about this application is the use of a stereographic projection. The Web Mercator projection seems to rule the roost in online mapping these days, so it is nice to see a different map projection get a rare outing.

When the map progresses from one paired serendipitous song to the next couple of users it animates to a new map view, which is particular interesting to watch with this stereographic projection. You also get a quick blast of each new song featured as the map animates around the world.

The map was created with the help of D3.js. If you want to use a stereographic projection in your own maps you can check out the D3.js code for this map projection and a demo stereographic projection map here.

I've Found Your Town on Google Maps


In a vain attempt to get people to try and share my NSFW map on social media I've added a little link to the map which creates a URL for the current map view. The map is a collection of some of the rudest place-names around the world.

You can now grab the URL address for a map view and insult your friends by sharing the link on social media sites such as Twitter. For example you could insult your friends by sending them a link to Bald Knob on the map, like this:

"I've found your town on Google Maps - http://goo.gl/7IHyNr"

I'm sure you can come up with even better insults. To link to a particular map view just click on the 'Get Link' option and cut & paste the address from your browser's URL address bar.

I've also renamed the map Your Town, mainly to provide a little hint about one way the map could be used to insult other people.

Animated Heat Mapping


Thanks to CartoDB's Torque library we are now used to seeing markers being animated on a map to represent changes in data over time. By adding and removing markers according to a time stamp the Torque library can be used to visualize relative intensity over time, such as in this Twitter map showing, News of  Ferguson on Twitter,

By not removing markers once they have been added to the map the Torque library can also be used to show the accumulation of data over time, A good example of this is this animated map of 72 hours of seismic activity in Iceland, Bárðarbunga - Last 72h in 10 Seconds. This map does not remove the markers once they have been added to the map so that a picture of where the most seismic activity has occurred emerges as the animation plays.

Real-estate data analysts Illustreets have taken yet another approach to mapping the relative intensity of geographical data over time. Their new map, London House Prices: Evolution Over 13 Years, visualizes the cost of property in London over 13 years by providing an animated heat map of property prices in London boroughs. As the animation plays the colors of each of the London boroughs changes to show the evolution of average house prices in each borough over the 13 years.

This Illustreets map also superimposes an animated line chart over the map, which plays in conjunction with the animated heat map. You can select any of the London boroughs from a drop-down menu to view an animated line chart comparing the average house price in the borough over the 13 years compared to the average London house price.

Wednesday, August 20, 2014

Making Sense of Ferguson Tweets


I've already stated my disinterest in Twitter's map, News of  Ferguson Spreads Across Twitter, which really signifies nothing except that a lot of people around the world have Tweeted about the situation in Ferguson. Mapbox has now released a map using Twitter data from Tweets about Ferguson which actually tries to make sense of some of the social media activity around the events unfolding in the Missouri town.

The opening map view in  Ferguson, MO, Tweets shows how visitors have converged on the town. The lines on the map show where people Tweeting in Ferguson have traveled from. Mapbox compared geotagged Tweets from Ferguson with previous Tweets from the same people to determine which Tweets were made by locals and which were made by visitors to the town.

This first map view shows an incredible influx into the town from across the world. Presumably a large proportion of these visitors are journalists and people working for news organisations.

The map includes three other views; Local Tweets, Visitor Tweets and All Tweets. Locals are determined by looking at whether the Twitter users had most recently tweeted within seven miles of Ferguson.  The 'All Tweets' view shows the local Tweets in green and the visitor Tweets in purple. This view shows that the visitors to Ferguson are mainly clustered around distinct locations, suggesting that reporters of a feather presumably tend to flock together.

You can read more about the map and this clustering of local and visitor Tweets on the Mapbox blog.

Mapping Seismic Activity at Bárðarbunga


Since 16th August there has been intense seismic activity at Bárðarbunga in Iceland. The seismic activity around the volcano, located under the Vatnajökull glacier in Iceland, has led to fears that the volcano may erupt. Yesterday the police closed and evacuated the area north of Vatna­jök­ull.

Aitor García Rey () has used CartoDB to create two maps of the ongoing seismic activity in the area around Bárðarbunga. Bárðarbunga - Last 72h in 10 Seconds is a Torque powered animated map of 72 hours of seismic activity. This map allows you to view the seismic activity in chronological order. The map was last updated yesterday (but seems to be getting daily updates).

The second map, Bárðarbunga: +1.6K Earthquakes in 72h, uses the same data to map the magnitude and depth of each recorded earthquake (the earthquake markers are scaled in size to represent their order of magnitude).

Fractal Mapping


Here is a Leaflet powered Fractal Map which allows you to view a number of beautiful fractal patterns. Using the map you can view a number of different fractals and use the map controls to zoom in and out on the repeating patterns.

The map includes a leaflet hash library, which means that you can pan and zoom the map to find your favorite fractal patterns and then share the view by cutting and pasting the URL. The map is also a neat demo of using the Leaflet mapping platform with HTML5 canvas and Web Workers. You can explore how this is achieved on the map's GitHub page.

Tuesday, August 19, 2014

Mapping Pedestrian Accidents


With so many great mapping visualization tools on the market it is tempting to just grab some geo-located data and throw it onto a map. You can then publish it online and shout out to the world, 'Hey look at this cool map'.

Twitter did that this week with their Torque powered map News of  Ferguson Spreads Across Twitter. The map has worked very well as an advertisement for Twitter (I've seen the map referenced in a number of the most popular websites this week and it has also continuously popped up in my Twitter stream). However I'm struggling to work out what this map tells us, except that the events in Ferguson have been mentioned a lot on social media.1

Not all of the popular news websites are guilty of this scatter-gun approach to data mapping. A number of news outlets, like The New York Times, The Guardian and The Global Mail, have really upped their game over the last few years and are creating some great mapped visualizations that help to explain the stories hidden behind the data.

With the availability of easy to use narrative mapping tools, like Esri Story Maps, CartoDB's Odyssey.js and Knight Lab's Story Map, we are also seeing many more independent map developers creating really interesting maps which try to look at the narratives and stories behind their mapped data.

However you don't have to use these narrative mapping platforms to create interesting maps. For example, I really like this map from the Boston Globe exploring Massachusetts Pedestrian Crashes.

I've seen a lot of similar maps over the years of car crashes, pedestrian accidents, bike crashes etc. A lot of cities now have this data available as open-data and it is a fairly easy job to simply throw that data on a map and publish it to the world.

What I particularly like about this map is how the Boston Globe has gone to the trouble to explore some of the hot-spots in the data. If you select the 'see hot-spots' link the map zooms to a hot-spot, creates a boundary around the location and a map inset attempts to explain some of the issues around why this location might suffer from an abnormally high number of pedestrian crashes.

TL;DR:  - I like this Boston Globe map

1 For a more detailed critique of Twitter's Ferguson map see this Floating Sheep article.

Wind Farm Mapping


Wind Farms Through the Years is an animated map showing the locations and the dates of when wind farms were constructed in the USA. The map animates through the years 1975 to 2013 adding the wind farms to the map by date of construction.

As the animation plays the map keeps a total of the number of wind farms constructed and the number of homes those wind farms could power. You can also drag the slide control to any year to view the totals for that year. The map also uses different colored markers to indicate the wind farms added in the current selected year.

Adding Markers in Mapbox GL


I wouldn't normally post this map showing the birthplaces of Liverpool Football Club players but it is the first Mapbox GL created map in the wild that I've seen which includes map markers. The map also includes text labels with the markers so could provide a useful source for anyone looking to add markers and / or text labels to a Mapbox GL map.

The Mapbox GL example maps includes one demo showing how to add markers to a map. That example, like this map, shows you how to add an icon for the marker and also how to add a text label to the marker. The Mapbox GL example map also shows you how to style the text label. However the Liverpool players map includes far more styling of the text labels than the Mapbox GL example, so could be a useful guide for anyone interested in adding text labels to their markers.

If you look at the source code for the Liverpool players map you can see how a halo is added to the text,

"text-halo-color": "white",
"text-halo-width": 1,
"text-halo-blur": 0.5,

You can also see in this map how you can control the size of the text label according to the zoom level of the map. In this case the text labels become bigger as you zoom in on the map,

"text-size": { "stops": [[2, 6], [4, 8],[6,10],[8,12],[14,16]]

Currently Mapbox GL doesn't work on Internet Explorer (although Mapbox say support for IE is coming soon). While IE isn't supported it is good practice to add a warning for IE users. This Liverpool players map doesn't include a warning but the Mapbox GL examples section does include an example of how you can Check for Mapbox GL Browser Support and alert users with non-supported browsers.

Monday, August 18, 2014

The Ferguson Story Map


The Washington Post has created a story map plotting the major events in Ferguson since the killing of Michael Brown.

The Angry Aftermath of the Missouri Shooting maps the protests, looting and other events that have hit Ferguson following the shooting of the unarmed teenager. You can navigate the map by selecting the categorized markers on the map or you can follow the story chronologically by simply scrolling down the page.

The map itself was created with the Leaflet mapping platform. If you are interested in creating your own Leaflet narrative map in this form you might find my How to Create a Story Map with Leaflet post useful. In this tutorial (and in the demo map) I explain how you can create a similar visualization to this Washington Post map using Waypoints.js and the Leaflet mapping platform.


Al Jazerra's has created a map visualizing the racial mix in Ferguson in an attempt to try to shine some light on the background behind the shooting of Michael Brown and the resulting protests.

St Louis, A Divided City uses 2012 census data to plot the main racial groups in each census tract area in the city. The map reveals that two of the northern tracts in Ferguson have an evenly distributed racial mix of whites and African Americans, while the tracts in the south have a far higher proportion of African Americans.

Al Jazerra claims that as '... more black residents moved in, whites in Ferguson began to move to outer suburbs'. They also say that the 'majority of law enforcement and local government officials are still white in Ferguson'.


Reddit has a live feed of news of the looting and protests in Ferguson. The Live Feed for Riot and Protest in Ferguson, MO. uses Tweets, scanner reports and other sources to provide first hand accounts of the developing situation.

The live feed is accompanied by a Google Maps Engine map of the incidents reported. The map sidebar organizes the incidents added by date. If you scroll down on the sidebar you can find the latest incidents added to the map.