Mapping the American Power Grid
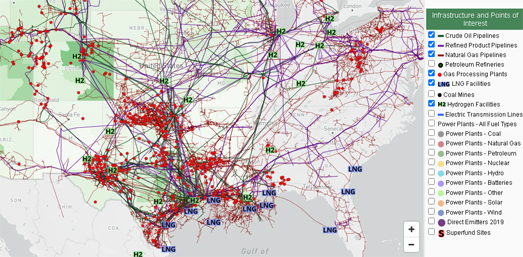
Last month Rice University's Baker Institute for Public Policy released a new interactive map which provides America's energy infrastructure. The Energy, Environment and Policy map shows the locations of the country's critical energy facilities.
The 'Infrastructure and Points of Interest' menu on the map allows users to add or remove different types of energy infrastructure from the map. These map layers include gas pipelines, and the different types of power plants used to power America. A second menu, 'Census Data and Raster Layers' allows you to add demographic and election data to the map. This menu includes layers which visualize population density, household income and the results of the 2020 election. Under this menu you can also find a map layer which shows the location of all active oil and gas wells.
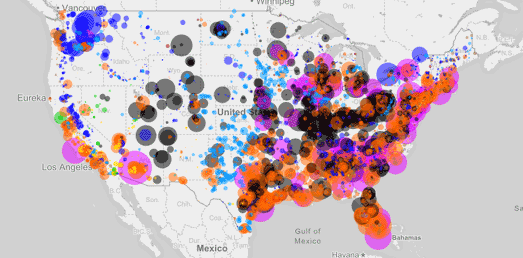
You can also explore how America generates power on the U.S. Power Plants map. U.S. Power Plants is an interactive map showing the locations, size and type of America's electric power plants. The map is a great way to see where different types of power plant are located, how much each type of energy source contributes to the country's power supply and how much each source contributes to CO2 emissions.
The number of map filters on U.S. Power Plants means that the map can provide lots of different insights into American power supply. For example the individual fuel filters allow you to see where different power sources are concentrated in America. Select hydro power and you can see that hydro power plants are concentrated in the north-west and north-east of the country. While solar power plants are mainly located in California.

Esri's Atlas of Electricity is another great way to explore where the USA gets its electricity from and how it distributes this power across the country. At the heart of an Atlas of Electricity is an interactive map plotting the location and size of the grid's
power plants and transmission cables. This map allows you to explore the location and capacity of the country's electricity producing power plants and how they connect to the national grid.
As well as mapping the physical infrastructure of the electricity grid this story map examines the primary energy sources used to generate electricity in the USA. It maps the size and capacity of coal-fired power plants, natural gas power plants and petroleum power plants. Alongside these fossil-fuel sources of power An Atlas of Electricity plots the size and capacity of the U.S.'s nuclear power plants, hydroelectric power plants and solar & wind power plants.


Comments