The Age of Disappearing Glaciers
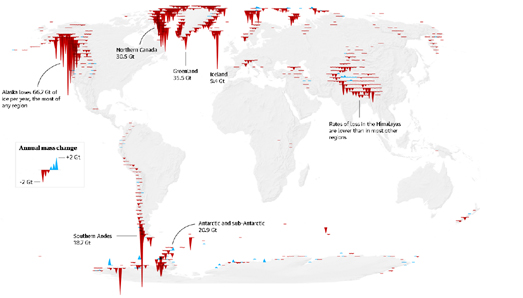
Last year The Guardian published a shocking map which visualizes the amount of ice that glaciers around the world are losing every year. The map uses profile plots to show the amount of ice lost (or in very rare occurrences gained) by glaciers around the world in a single year.
The Guardian's map in Speed at which world’s glaciers are melting has doubled in 20 years uses data from the paper Accelerated global glacier mass loss in the early twenty-first century to help show how glacial melt is driving sea level rise. Between 2000 and 2019, as a direct result of global heating, glaciers lost 267 gigatonnes (Gt) of ice per year. This contributed to around one fifth of the rise in sea levels over that time.

You can see for yourself how much Svalbard's glaciers have shrunk in the last 80 odd years on Yoni Nachmay's interactive map Svalbard 1936/1938. Yoni's map compares historical aerial imagery of Svalbard's glaciers (captured in the 1930's) to the modern aerial imagery of the same glaciers captured by Maxar Technologies.
In 1936 and 1938 Adolf Hoel used a scout plane to capture aerial imagery of much of Svalbard archipelago. Yoni's Svalbard 1936/1938 map places the vintage photographs of Svalbard's glaciers (taken by Adolf Hoel) side-by-side with modern aerial imagery to clearly show the dramatic extent which these glaciers have shrunk. The result is that you can see for yourself just much these glaciers have melted over the last 80-90 years.
You can explore other powerful interactive visualizations of glacial melt in the Maps Mania post Melting Glaciers.
Comments