Mapping the Health Effects of Climate Change
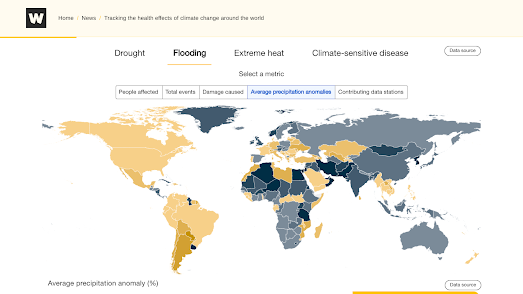
The Wellcome Trust has mapped out 120 years of climate data in order to explore the health effects of climate change. In Tracking the health effects of climate change you can see where around the world drought, flooding, extreme heat and climate-sensitive disease have affected the health of the local populations.
Select one of the four climate metrics and you can see how every country in the world has been affected by these climate events over the last 120 years on an interactive map. For example if you choose 'Drought' the interactive map will show the number of people affected, the total number of events and the damage caused by flooding in countries around the world.
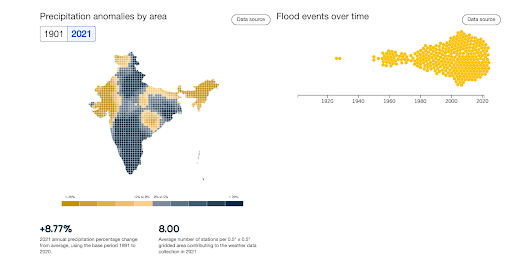
You can also explore the health effects of climate change over time for individual countries. If you select a country from the drop-down menu you can view a map which shows climate anomalies by area and over time. For example if you select to view the flooding data for India you can see a map showing where flooding anomalies have most occurred and a timeline of flooding anomalies by year (shown in the screenshot above). The timeline of flood events in India over time clearly reveals the growing problems of flooding in the subcontinent over the last few decades.
Comments