The Paris Noise Pollution Map
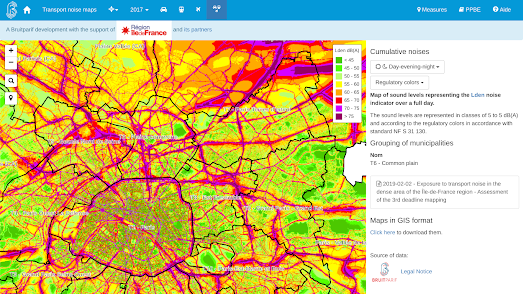
The Bruitparif Paris Transport Noise Map visualizes noise pollution within the Île-de-France region. The map shows the estimated level of noise pollution generated by cars, trains and planes across all of Paris.
Essentially the Paris Transport Noise Map provides a heat map view of the levels of transport noise in the capital. The map allows you to view noise pollution generated by cars, trains, planes, or a cumulative noise pollution visualization of all three combined. The noise pollution levels are determined by computer modeling and not from actual measurements.
The main criticism of computer modeled maps of noise pollution is that they are little more than maps of transport infrastructure. However when done well, like the Paris Transport Noise Map, they take into account the effect of buildings, noise screens, traffic levels, average speeds and road surfaces on the amount of noise pollution generated.
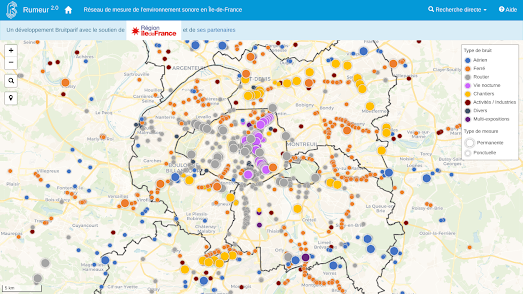
Bruitparif actually has deployed sound radars which capture noise pollution levels across the French capital in real-time. You can view the noise pollution levels recorded by these sound radars on its Rumeur interactive map.
The Rumeur map allows you to view the sound levels recorded by any of the sound measuring stations in Paris. Click on a sound radar's marker on the map and you can view its current 'real-time' noise pollution reading and its measurement history. An interactive chart allows you to observe the selected station's entire history of decibel level measurements.


Comments