Global Plastic Watch
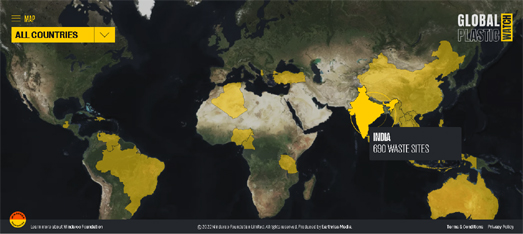
The world's plastic waste is now being mapped from space. Global Plastic Watch (GPW) has released a new interactive map which tracks the world’s plastic pollution in near real-time by using artificial intelligence to identify plastic waste sites in satellite imagery.
GPW's algorithms can identify plastic waste sites as small as 5x5 meters. By identifying and mapping sites where plastic waste is being dumped GPW can help governments and agencies around the world tackle the problem and help to prevent the flow of plastics into the oceans.

one of 373 plastic waste sites identified in Indonesia
If you select a country on the interactive map you can view a country report which identifies the number of plastic waste sites found, the surface area of land being used for plastic waste, and the waste production per capita. Select an individual plastic waste site on the map and you can view the satellite imagery of the site for yourself, and (where available) even explore nearby Google Maps Street View of the site.

You can see how plastic from individual waste sites is likely to reach the sea on an interactive map from Ocean Cleanup. The Plastic Tracker map allows
you to track the probable journey that plastic waste is likely to take from any location to the ocean. Enter a location into the Plastic Tracker map
and it will calculate the chances of a piece of plastic abandoned to
the environment at that address reaching the ocean and will also map the
journey that the plastic would likely take.
The Plastic Tracker map plots the journey that a single piece of plastic is likely to take from the moment it is discarded. It shows the possible route that the plastic would take to reach the sea based on data such as river flow, river mouth emissions and ocean currents.
The Ocean Cleanup organization believes that between 1.15 to 2.41 million metric tons of the plastic in the oceans originates from the world's river systems. Two thirds of it from the rivers of Asia. The River Plastic Emissions to the World’s Oceans interactive map helps to visualize how and where that plastic ends up in the world's oceans.
This map shows river systems around the globe. The predicted input from
each river system is shown at the coast using scaled circular markers.
These predicted inputs are based on a model which looks at population
density, waste management, topography, hydrography, the locations of
dams and the reported concentration of plastic in rivers around the
world.


Comments