The Deadly Streets of San Francisco
Six times a day, every day of the week someone is injured by a car in San Francisco. A car injures someone approximately every four hours on the city's streets. Around every 13.19 days a person is killed by a car in the city.
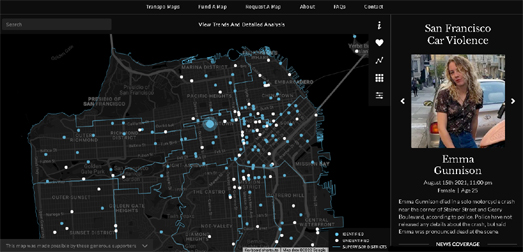
The San Francisco Traffic Fatality Map hopes to shame the city's elected officials into action by identifying and memorializing all the victims of car violence in San Francisco. The map shows the locations of every fatal motor vehicle crash on the streets of San Francisco, it identifies the victims of these crashes and attempts to explain the circumstances surrounding each crash.
On the map each identified victim of a motor crash is indicated using a blue circle (the white circle are fatalities where the victims haven't yet been identified). If you click on one of these blue circles you can read more about the victim and how they were killed. The use of names and photos has a huge emotional impact and is incredibly effective in humanizing what might otherwise have appeared as just faceless data.
However the San Francisco Fatality Map isn't merely a memorial to the city's victims of car accidents. The map also provides data which could be helpful to the city in achieving its Vision Zero objectives. If you click on the map's 'analysis' button you can view a breakdown of San Francisco car fatalities data by date and by location. You can also explore a detailed breakdown of the data by the age and gender of the victims and of the victim's mode of transport. For example this analysis reveals that pedestrians are by far the highest number of people to be killed by cars in San Francisco.


Comments