
Most of the successful UK election maps over the last week have used hexagon grid maps or plain square grid maps.
The npr Visuals Team has published an interesting article exploring the design choices that they made for using hexagon grid maps in some of their recent data visualizations. Let’s Tesselate: Hexagons For Tile Grid Maps explains why and how the Visuals Team have been creating hexagon grid maps for a number of mapped visualizations on NPR.

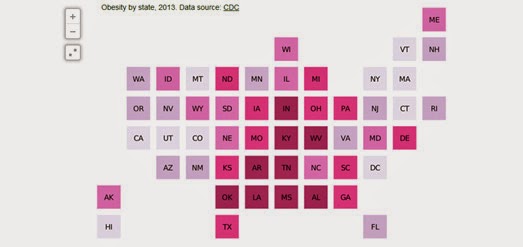
If you want to create your own USA state grid maps you can follow Kyle Walkers tutorial on how he created a grid map to show obesity by state in the USA. Obesity by state, 2013: a CartoDB state squares experiment uses a state squares GeoJSON file shared by Bill Dollins on his GitHub repository.
Just for the hell of it I decided to create my own Leaflet.js square grid map from the same GeoJSON file. Kyle Walker's CartoDB map has added obesity data for each state to the GeoJSON. My Leaflet map has no added data (so all you can do is hover over each state to reveals its name).
You can explore the HTML of my map to see how it is made. Essentially it is just a matter of loading Bill Dollin's state squares GeoJSON data.
You can explore the HTML of my map to see how it is made. Essentially it is just a matter of loading Bill Dollin's state squares GeoJSON data.
No comments:
Post a Comment