
In How to Create Grid Maps I gave an example of a square grid map created using the Leaflet.js mapping library. I really wanted to add an example of a hexagon grid map to that post but I didn't have the time to create the hexagon shapes.
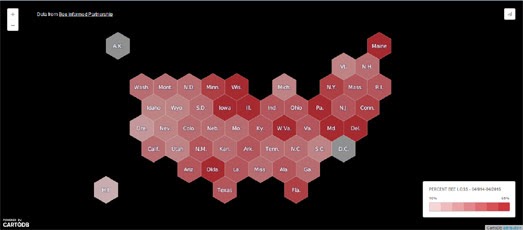
CartoDB however has come to the rescue with this nice hexagon grid map of Bee Loss in the USA. The map shows the percentage of bee loss in each state from April 2014 to April 2015.
The hexagon polygons for the Bee Loss map is provided in a table view with a neat little button to download the data as a GeoJSON file. So what's a guy to do? Well - this guy shamelessly 'borrowed' the data and created a Leaflet Hexagon Grid map.
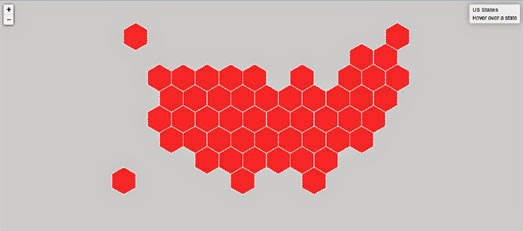
This Hexagon Grid Map provides a little example of how you can create a hexagon grid map of USA states with Leaflet.js. You can mouse-over each state to view the state name. Ideally each hexagon should include a label for the state represented. That should be fairly straightforward to achieve using the Leaflet.label plug-in.
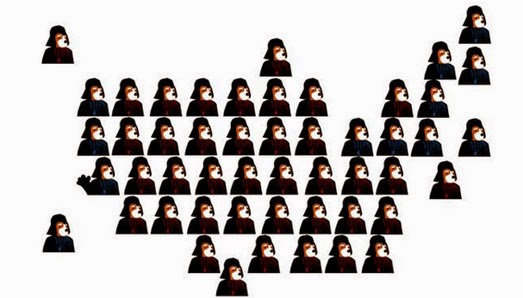
If hexagons don't float your boat - then other shapes are available. Flowing Data has been compiling a list of other shapes that have been used for grid maps.
No comments:
Post a Comment